Since the beginning of the Industrial Revolution in the 18th century, the world has increasingly relied on technologies that emit greenhouse gasses. In the 20th century, economies shifted away from mechanical technologies and toward digital technologies that permeate nearly every industry and aspect of life. This large-scale adoption has caused greenhouse gas emissions to increase exponentially.
These gasses have dangerously altered the Earth’s atmosphere, causing global temperatures to rise an average of more than 1C, and sea levels to rise 8-9 inches (21-24 cm). In this article, we’ll take a close look at the source and scale of big tech’s emissions. We’ll also look at various sub-sectors and their impact, as well as the efforts tech companies are making to reduce their emissions.
An Overview of Tech’s CO2 Emissions
Since the beginning of the industrial age, the global average of Earth’s temperature has risen by 1.2C — and much of this rise can be attributed to CO2 emissions over the last century. Before we dive into the emissions of various niches of tech, let’s explore some significant stats across the industry.
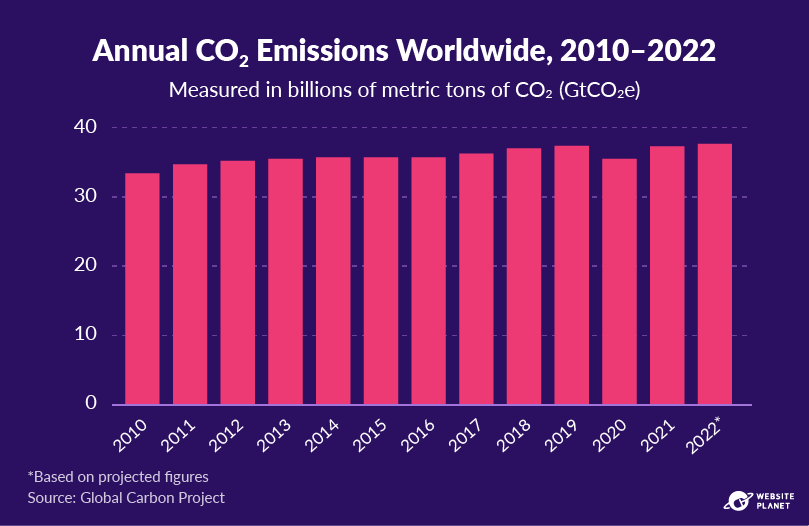
#1: Global CO2 Emissions Continue to Be Staggeringly High
Total global carbon dioxide emissions have, by and large, been on the rise since the mid-1800s, and especially in the last decade. 2020 was a notable exception; the global pandemic caused many carbon dioxide-producing industries to be shut down for extended periods, causing total emissions to drop that year. Overall, 2021 saw emissions return to prior levels, with 2022’s figure being similar.
Compared to pre-industrial averages (prior to c. 1850), the Earth’s temperature has risen by an average of around 1.2 degrees Celsius — and with major climate agreements targeting a rise of 1.5C or less by the end of the century, these emission trends need to slow, and ideally reverse.
Many tech giants are playing their part in tempering their emissions, but before we can see meaningful change, companies across every industry must play their part.
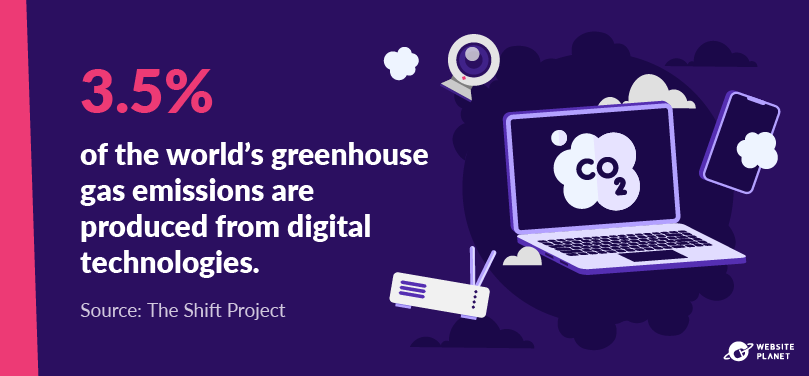
#2: The Tech Industry’s Contribution to Global CO2 Emissions
Today, various forms of digital tech are deeply ingrained across all aspects of our daily lives. They’re in our smart watches, street lights, vehicle sensors, and nearly everything else. As a result, digital tech is currently responsible for 3.5% of all greenhouse gas emissions, with an energy consumption that’s rising by around 6% each year.
Emissions are often put into two categories: direct and indirect. For digital tech, direct emissions come from processes like manufacturing, logistics, procurement, and office upkeep. Here, emissions are directly caused by factories, vehicles, or things like keeping buildings heated.
Conversely, indirect emissions come from end-use power consumption, which has an implied emission cost. Even consumers simply scrolling their Twitter feeds have a measurable emission cost; for instance, charging the devices they’re using, the energy needed by the cell tower or Wi-Fi router they’re connected to, and the increased demand they’re placing on Twitter’s servers.
The largest culprits in the tech sector typically cause both significant direct and indirect emissions. For a real sustained improvement, we’ll need to see widespread shifts to greener energy.
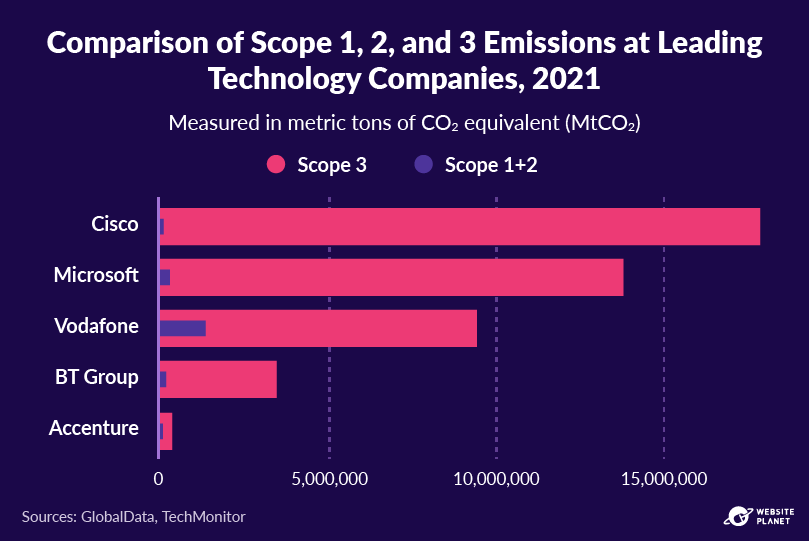
#3: The Tech Industry Struggles to Contain Scope 3 Emissions
Scope 1 emissions are direct emissions: emissions as a result of fuel combustion, refrigerants, transportation, and manufacturing. Scope 2 are indirect emissions caused by the company in question due to their energy consumption and source.
Finally, Scope 3 emissions are the most tricky to track, as they’re the emissions that result from all up and downstream supply chain emissions related to the company — including logistics, employee business travel, and end-user consumption.
Because Scope 3 emissions are so difficult to track, you have to take self-reports of tech company emissions with a grain of salt — even if they’re trying to be above board, they may not have the full picture.
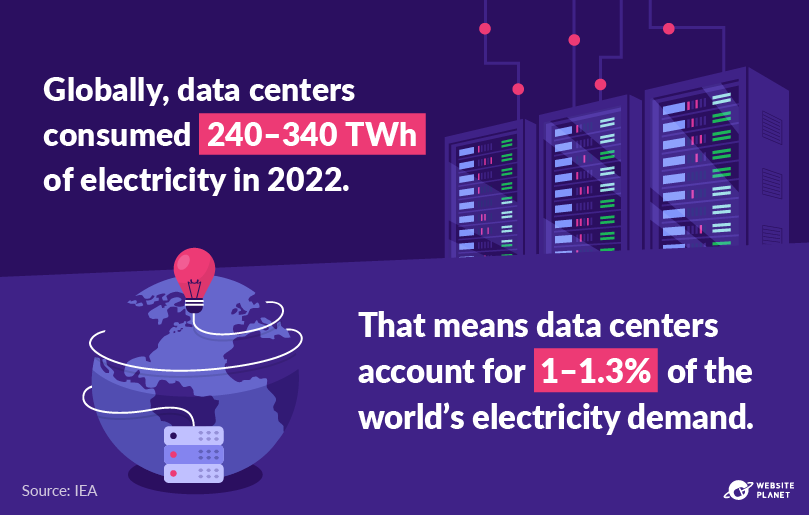
#4: Data Centers Demand a Huge Portion of Earth’s Electricity
The global energy consumption of data centers is a matter of serious concern. With an estimated 240-340 TWh used annually, this demand is significant enough to rival the total energy needs of many countries.
At present, the vast majority of this energy comes from fossil fuels that are detrimental to the planet. For one example, a data center hub in Northern Virginia — dubbed Data Center Alley — processes 70% of the world’s internet traffic. It’s unfortunately reliant on local power sources such as Dominion Energy — which largely runs on fossil fuels.
However, this reliance on fossil fuels may see a drop in the years to come, with many large tech companies placing a much higher emphasis on renewable energy sources.
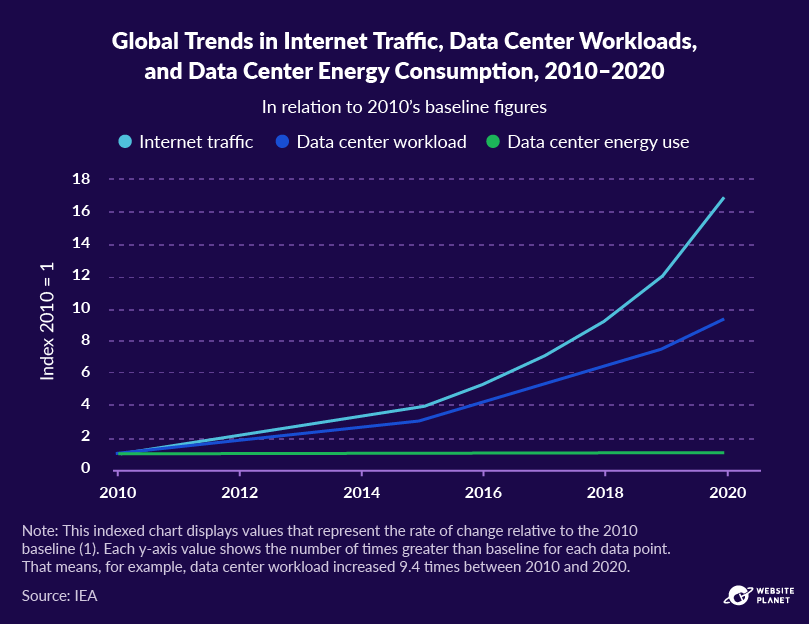
#5: Better Technology Has Led to Far More Efficient Data Centers
Despite rapidly growing internet traffic, and the subsequent increase in workloads for data centers, their energy usage remained fairly stable through the 2010s — albeit still, in absolute terms, an enormous amount of electricity.
This leap in efficiency needs to continue for data centers to maintain — or ideally, reduce — their carbon footprints in the future. This will also need to be paired with cleaner energy sources, which will mean that data centers need to operate in regions that have such energy sources readily available.
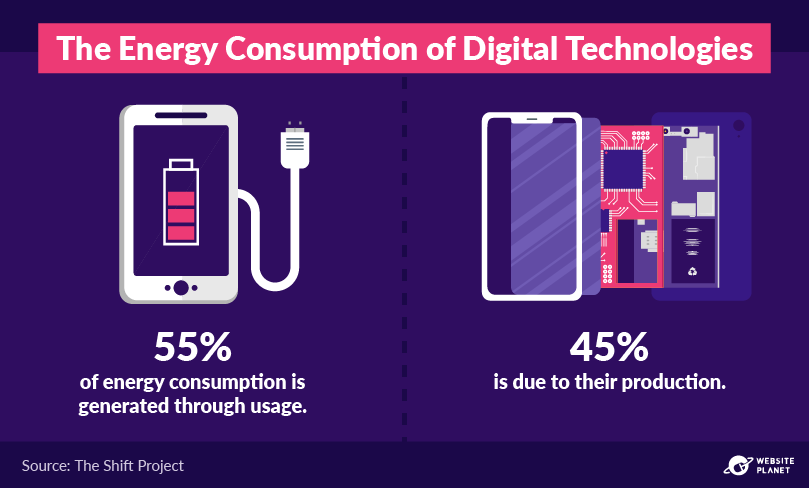
#6: Using Digital Technologies Consumes More Energy than Producing Them
It may seem counter-intuitive that digital technologies consume more energy for simply using them than they took to produce, but this just speaks to the sheer scale at which they’re used.
Production is usually a short-lived process in which companies have a great deal of control and are incentivized to save money. Leaner processes with minimal waste in mining, refining, manufacturing, and transportation are also often relatively green, compared to use.
But these goods last for years and require energy not only for their own power, but also to connect to the web and store and retrieve data in the cloud.
Keep in mind, however, that this is just an average across all digital technologies — over 90% of the emissions caused by mobile phones, for instance, are from their production and disposal, as they’re efficient devices that don’t require a lot of energy to power. On the other hand, products like TVs and laptops require a lot more energy to run, and as a result, use more energy than their production.
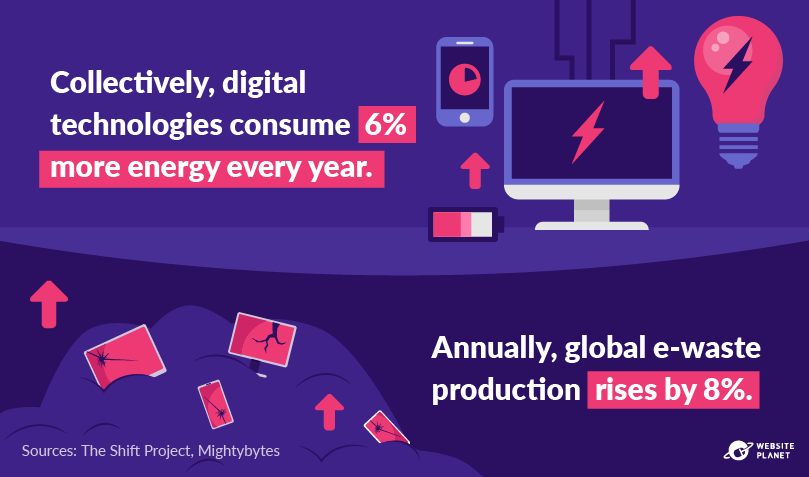
#7: Digital Technologies Use More and More Energy Every Year
As society’s dependence on digital technologies increases, so does the technologies’ total energy consumption.
Additionally, companies develop tech products with a business model of planned obsolescence. Before a product is put on the market, companies often have a new model in the works with improved features, all but guaranteeing their users will look for upgrades in the future. This contributes to the increasing amount of electronic waste being produced. In 2019 alone, 53.6 million metric tons of e-waste was produced — a figure that is projected to rise 30% by 2030.
E-waste can be toxic and is not biodegradable, causing an environmentally harmful accumulation in landfills. Over time, toxic substances from this waste can leach into the soil, water, and air, causing irreversible damage. Additionally, e-waste is often burned, releasing toxic substances into the atmosphere.
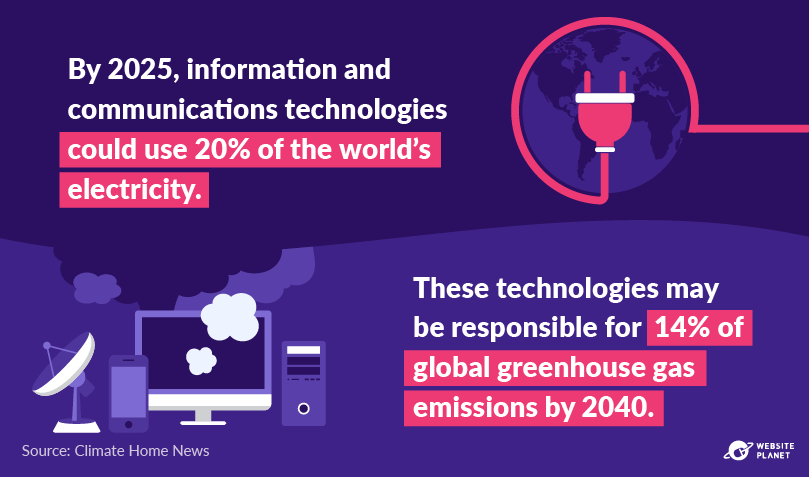
#8: The ICT Sector’s Carbon Footprint Is Growing Exponentially
ICT (information and communications technologies) refers to all tech used for gathering, storing, transmitting, retrieving, and processing information.
The global ICT industry is projected to be responsible for 14% of all global greenhouse gas emissions by 2040. This is roughly equivalent to the total emissions caused by the world’s second-largest emitter today, the US.
These projections challenge the claim made by many large companies in the industry that they can increase efficiency and reduce waste, and instead anticipate the industry’s carbon footprint to continue its upward trend.
#9: Researchers Often Overestimate the Amount of Electricity Used by the IT Sector
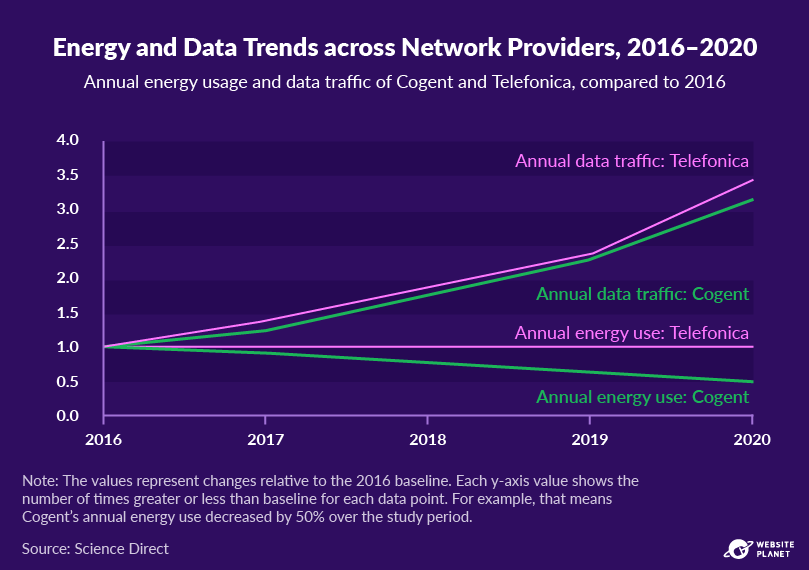
Telecom corporations have held their energy use relatively constant over the last decade, despite their data traffic consistently growing over time. This has defied predictions made by researchers in the past, who estimated that these energy usage figures would grow alongside their data traffic.
This is likely thanks to huge leaps in technology that allow far greater energy efficiency than researchers in the past thought possible. The inner workings of these mechanisms are proprietary, and telecom companies often keep the methods of their largest efficiency gains secret to maintain an edge over their competition.
The Best and Worst among the Tech Industry
The largest players in the tech industry have been making unequal progress toward reducing their emissions. In this section, we’ll take a closer look at the climate-oriented performance of some of the largest players in the industry, and the factors that influenced these results.
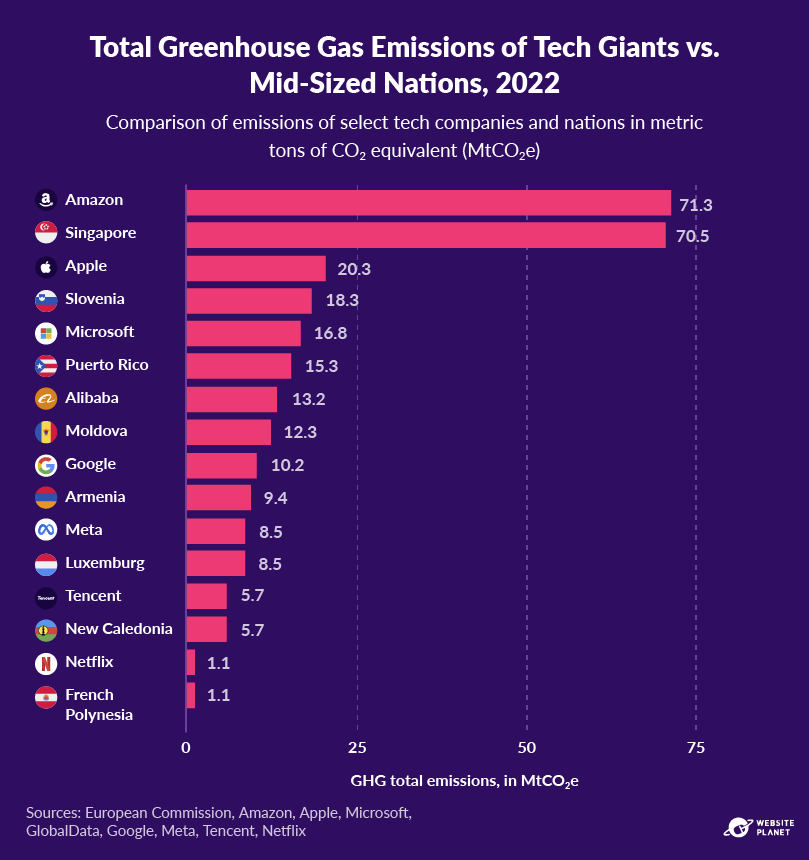
#10: Tech Giants Emit More than Many Midsized Nations
When we take a closer look at the total emission figures of some of the giants in the tech industry — counting emissions from Scope 1, 2, and 3 — the figures are rather shocking, surpassing the total emission figures of many countries in 2022.
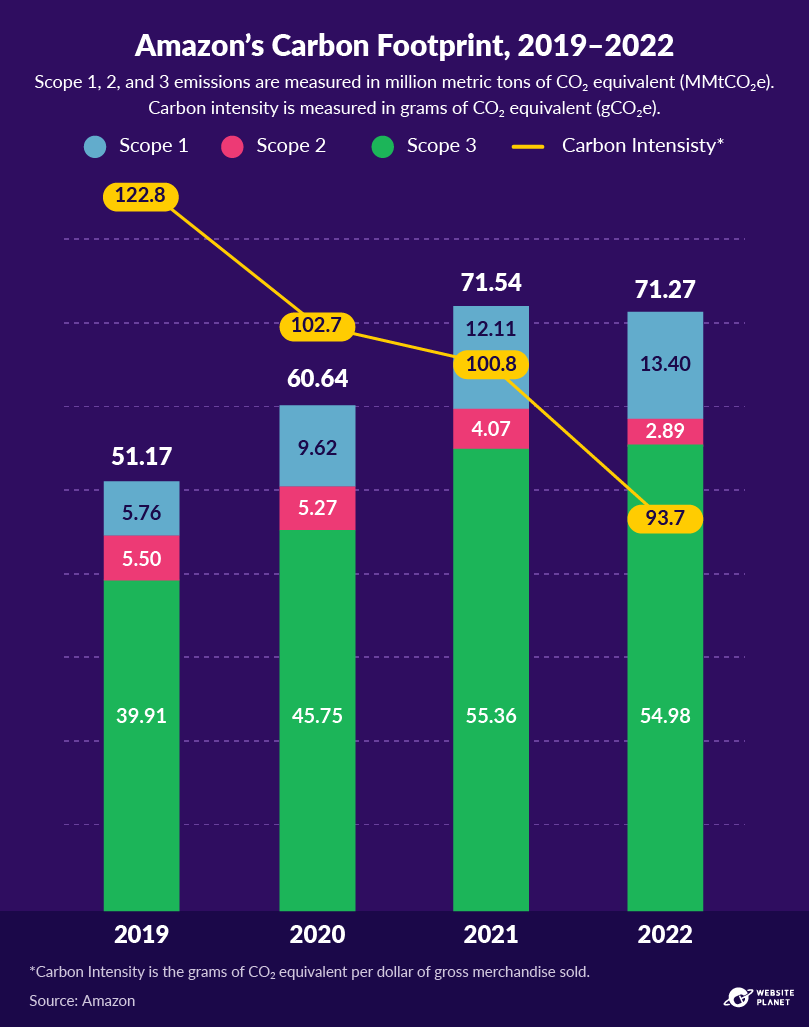
Many of these tech behemoths are making progress. Amazon, for instance, was responsible for slightly less greenhouse gas emissions in 2022 than it was in 2021, by the equivalent of around 0.3 million metric tons of carbon dioxide.
While Amazon has made strides toward being more sustainable, such as powering 90% of its operations in 2022 with renewable energies, its total emissions still surpass that of all but around 20 countries worldwide.
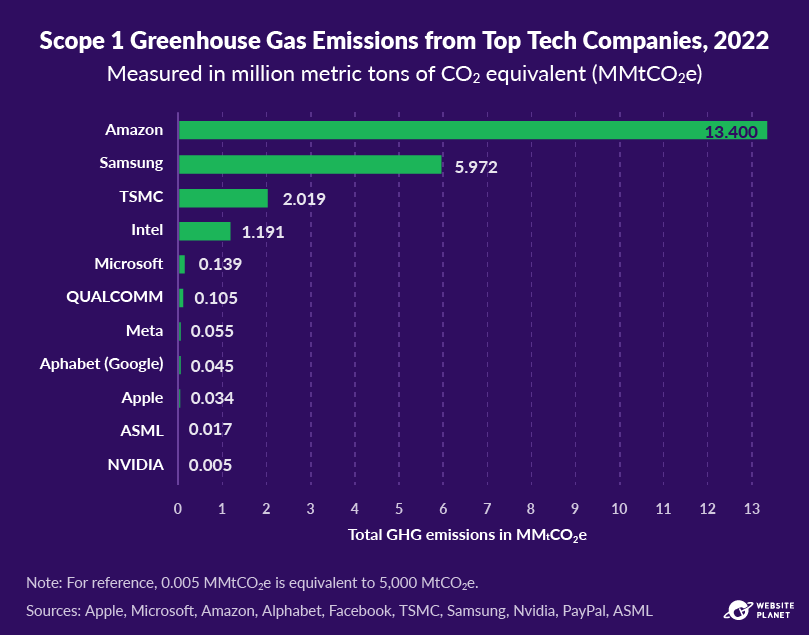
#11: Amazon and Samsung Had the Highest Operational Emissions in 2021
Looking at Scope 1 emissions alone, Amazon and Samsung were the largest carbon emitters in 2022, with many other similarly large companies emitting far less. To get a sense of its sheer scale, Amazon’s Scope 1 emissions were equivalent to the output of 2.9 million cars.
Amazon did, however, pledge a strategy to achieve net-zero emissions by 2050. Despite this, it hasn’t achieved a great deal compared to other Big Tech companies like Meta and Alphabet, which already had Scope 1 emissions of less than a tenth of a million tons of carbon dioxide. In fact, Amazon’s Scope 1 emissions in 2022 were greater than its 2021 figure.
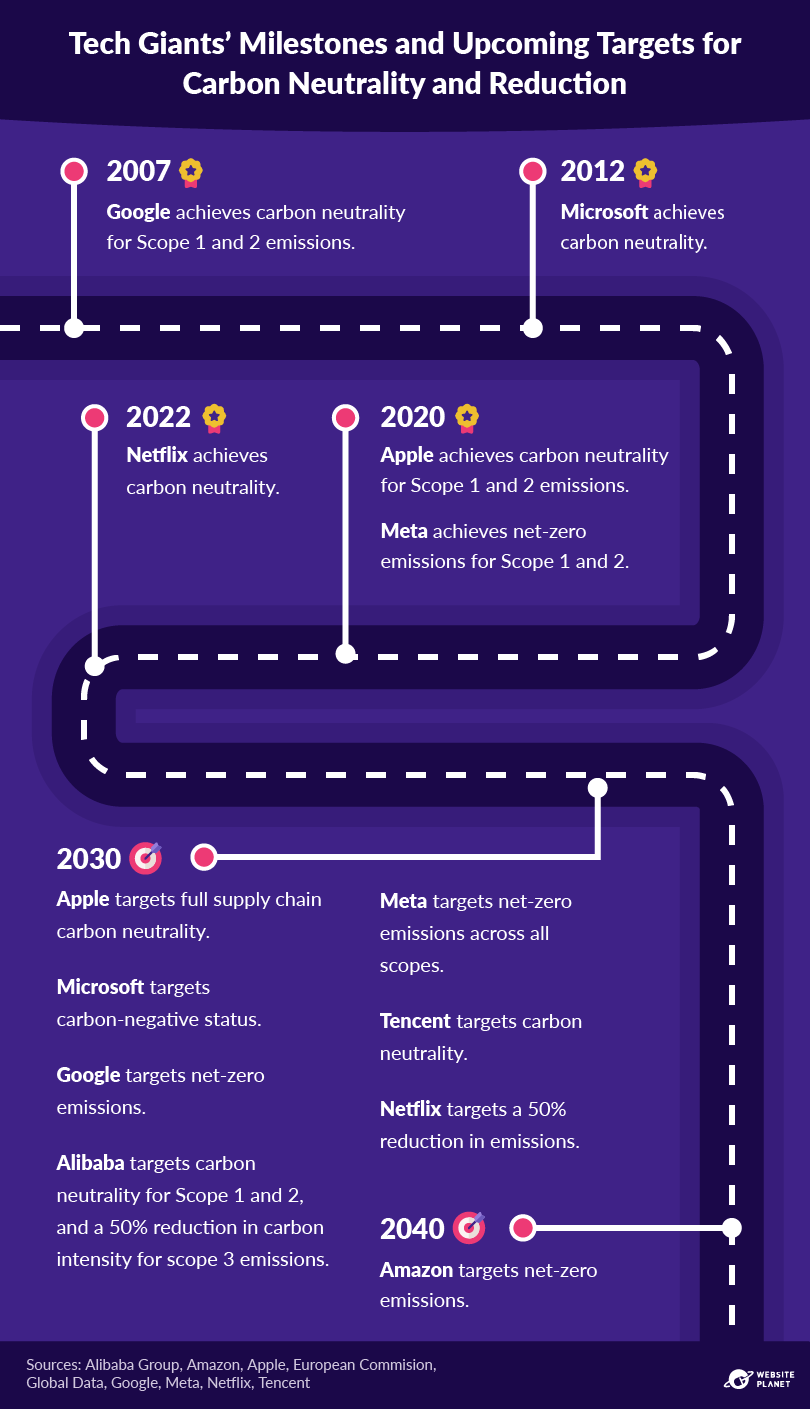
#12: Tech Giants Recognize Their Impact and Commit to Do Better
The major players in the tech industry are making varying amounts of progress toward achieving climate and sustainability goals.
Carbon neutrality refers to companies offsetting their carbon emissions by purchasing renewable energy or carbon offsets, while net-zero refers to getting rid of all their emissions entirely. There can be a degree of ambiguity when talking about carbon neutrality, that is, whether the emissions in question are operational (scope 1 and 2) or across the entire value chain.
Google, Microsoft, Apple, and Netflix have all been carbon-neutral for operational emissions since 2007, 2012, 2020, and 2022 respectively, but are still a long way off from being fully carbon-neutral, and a longer way still from being net-zero. Regardless, these companies are paving the way for a greener tech future.
#13: Despite Its Net-Zero Pledge, Amazon’s Emissions Have Been Increasing
All of the Big 5 Tech companies — Amazon, Meta, Microsoft, Apple, and Alphabet — have pledged to be net-zero emitters by 2040.
Despite making this pledge in 2019, Amazon’s greenhouse gas production has largely been on the rise over the last few years. However, in 2022, its figures suggest this trend may be slowing: while Amazon’s Scope 1 emissions grew, its Scope 2 and 3 emissions fell, bringing its total lower than its 2021 figure.
It’s worth keeping in mind that experts have alleged that Amazon hasn’t been reporting its emissions from third-party vendors — if we include these emissions, the total figure is likely to paint a less optimistic picture.
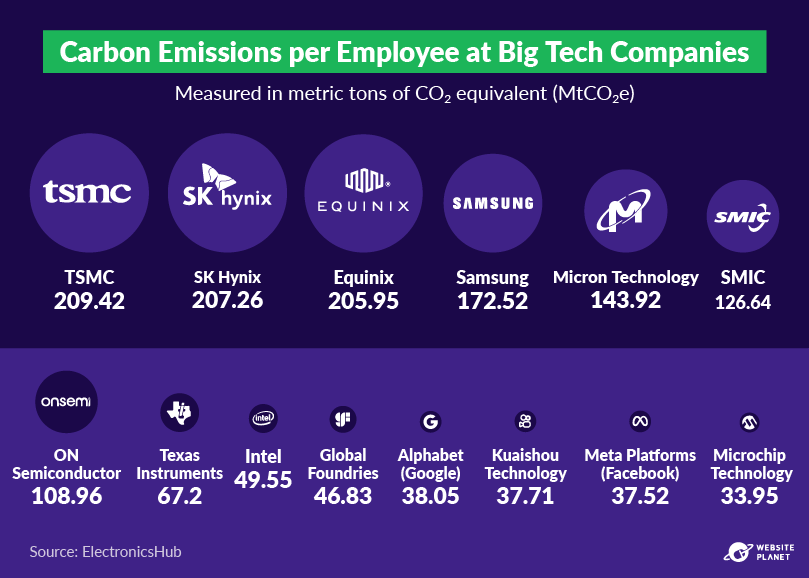
#14: Semiconductor Manufacturers Emit the Most CO2 per Employee
In absolute terms, Samsung was the largest emitter of carbon dioxide equivalent (CO2e). However, if you look at these figures on a per-employee basis, TSMC, SK Hynix, and Equinix had higher numbers, with Samsung not far behind.
Some reasons for this could be that semiconductor manufacturing, in general, creates a lot of greenhouse gases, depending on the type of energy used. Also, key components for semiconductor manufacture require rare earth metals such as silicon, gallium arsenide, and germanium — all of which create a lot of emissions to mine and refine.
Equinix’s story is similar. Data centers create a lot of emissions, largely based on their power consumption, and Equinix is a behemoth in the data center space.
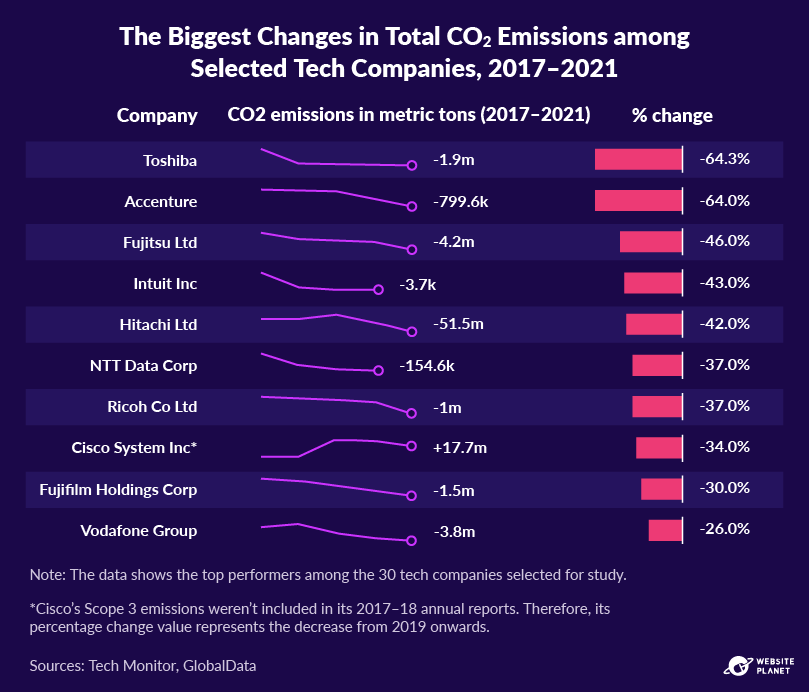
#15: Toshiba and Accenture Pave the Way for Greener Operations
Between 2017 and 2021, Toshiba and Accenture each reduced their CO2 emissions by around 64%. This was a huge drop, both proportionally and in absolute terms — particularly for Toshiba, which decreased its emissions by 1.9 million metric tons of CO2e. Fujitsu made a sizable reduction in absolute terms, as well, with a drop of 4.2 MtCO2e.
While these companies are setting a stellar example, not all tech companies have shown this level of commitment toward reducing their carbon impact. The industry needs to make more progress on this front, particularly from companies in India and China, to meet international goals for emissions and warming.
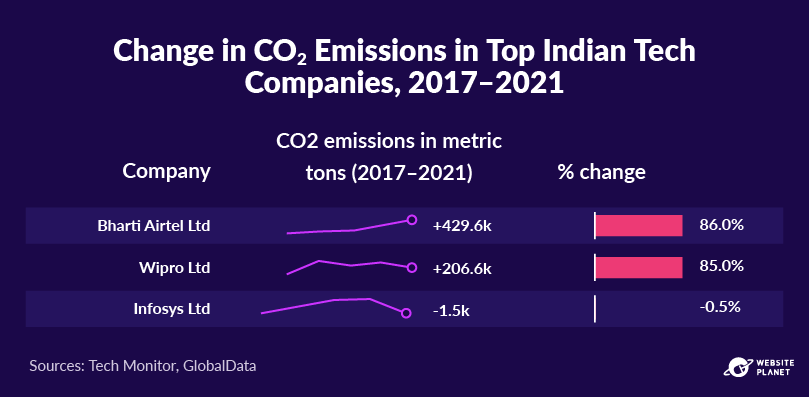
#16: Indian Tech Giants’ Emissions Nearly Doubled Over Four Years
Many tech companies in India aren’t showing the same reduction in emissions as some of their Western counterparts. Currently, the infrastructure in India is reliant on dirtier energy sources, without many suitable clean alternatives. As a result, tech companies are often left with no alternative.
It’s worth keeping in mind that countries like India are at a different stage in their economic development than many Western countries. When countries from the developed West were at a similar stage of their economic development, they also relied on inexpensive, dirty energy sources like coal that were environmentally damaging. It was the heavy use of these unclean energy sources that helped the West build its current wealth.
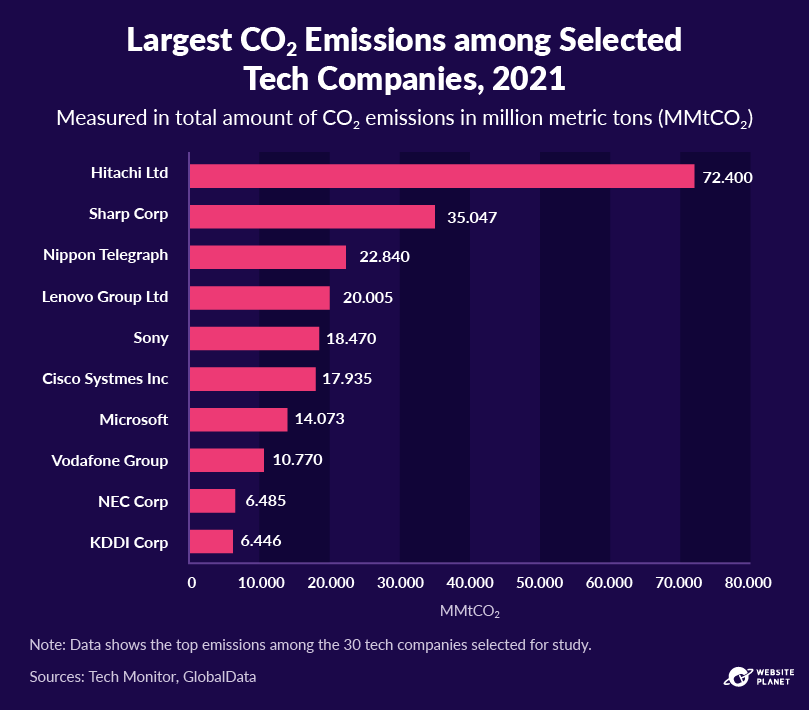
#17: Comparing Tech Giants’ CO2 Emissions
Few tech giants achieved as large a reduction in carbon dioxide emissions between 2017 and 2021 as Hitachi, both in proportional and absolute terms. It emitted 120 million tons of carbon dioxide in 2017 and nearly halved this figure by 2021. However, its emissions were still enormous, with over twice as much as the next largest emitter among those studied, Sharp.
For both multinational companies, the vast majority of their emissions came from Scope 3 — in particular, those from consumer usage after purchase. The other companies in this list of high-carbon impact players have all shown either marginal progress or regression.
Consumer Electronics
Today, consumer electronics are everywhere, from handheld devices to smart appliances. It may seem inconsequential on a micro-scale, but their cumulative emission cost — both to produce and to use — adds up. Let’s take a closer look at the facts surrounding consumer electronics.
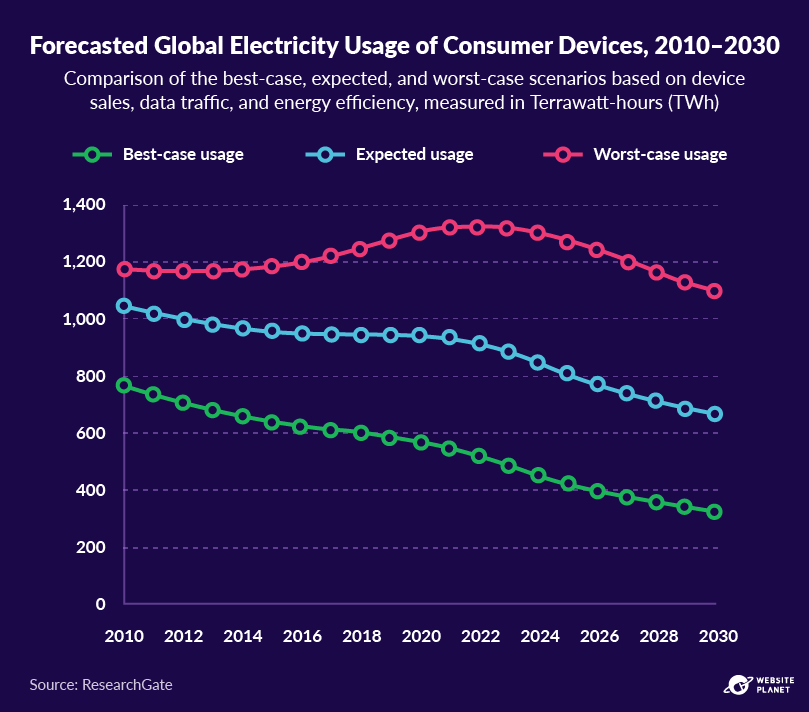
#18: Consumer Devices Are Becoming More Efficient
Consumer devices are expected to become increasingly ubiquitous with the increased adoption of the Internet of Things (the network of devices connected to, and exchanging data through, the internet). However, their total global electricity cost is forecast to drop. Some of the major factors contributing to this downward trend in the electricity use of consumer devices are advances in power-saving architectures, management, and technologies.
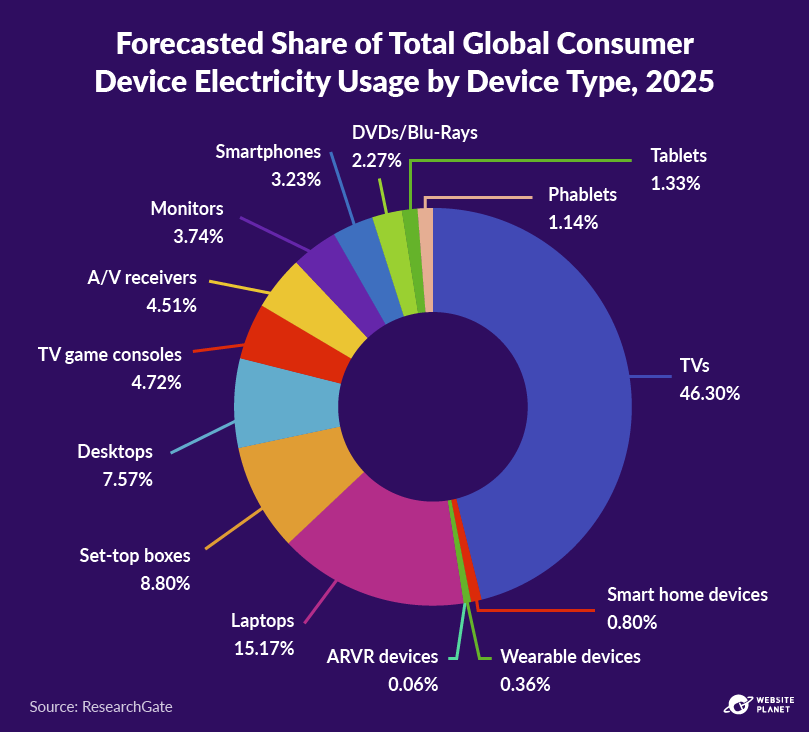
#19: Which Consumer Devices Use the Most Electricity?
By 2025, consumer devices are expected to make up 2.8% of global electricity usage, which is more than the total predicted for fixed-access WiFi (0.3%), but less than that of data centers (4.5%).
The consumer device power use both today and forecasted for 2025 is dominated by processing and displays — with televisions and their peripheral devices accounting for around 65% of the total, and computers and their peripherals accounting for around 25%.
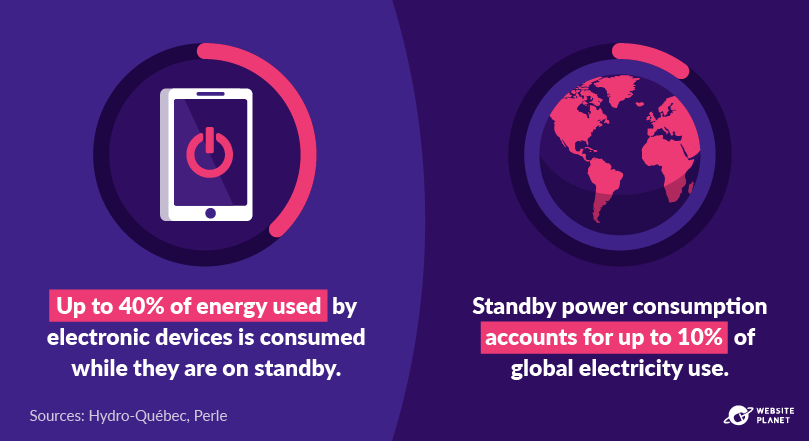
#20: Digital Devices Consume Power Even When They’re Turned Off
Many home electronics devices like televisions, computers, refrigerators, and washing machines aren’t ever really fully turned off — instead, across all devices, they’re left on standby an average of around 75% of the time.
When these devices are left on standby, they demand anywhere from 0.1 to 30 watts of power, and for many devices, this can be true even if they have, ostensibly, been fully turned off. If standby power consumption of these devices could be lowered to 1 watt, this would lower annual carbon dioxide emissions by nearly 2 megatonnes — a huge savings.
Additionally, users can help the cause by simply being more conscientious about their power use: using devices like smart power bars and simply unplugging devices when they’re not in use, rather than putting them on standby, can help.
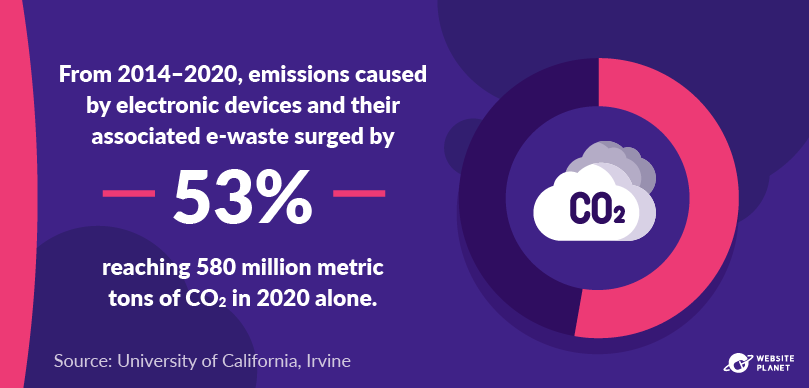
#21: Electronic Device Emissions Jumped by over 50% between 2014 and 2020
In addition to creating a substantial carbon footprint, electronic waste also exposes over 30 million people to increased levels of toxic waste in the 32 cities that house large-scale e-waste recycling centers around the world. While all landfills contain varying levels of e-waste, the effects are most pronounced in these regions.
E-waste also changes the concentration of hazardous metals in the air, water, and soil at and around their disposal and recycling sites. Major governing bodies like the WHO and the EU set permissible standards for these metrics — and many of these sites report higher concentrations than recommended, causing an increased risk to people living in these regions.
Pinpointing the exact reason for the drastic surge in e-waste is challenging — however, it’s likely a combination of far more widespread electronic device usage, combined with consumers discarding electronics more frequently than in prior decades.
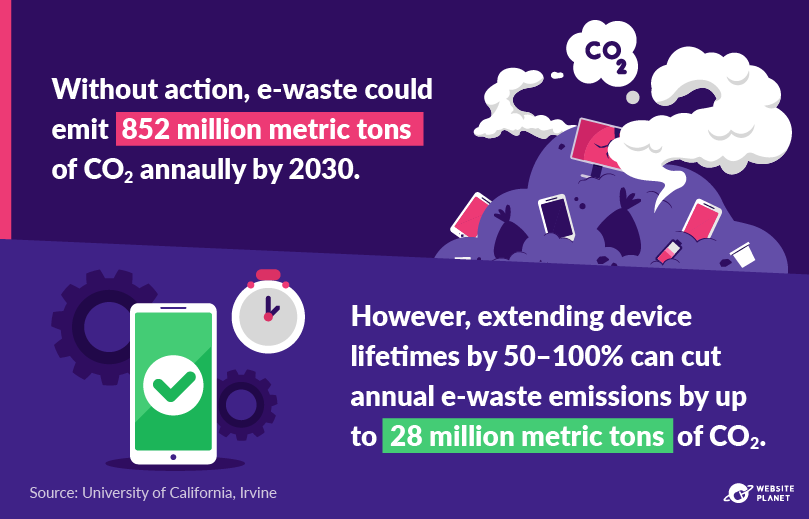
#22: Electronic Waste Has a Huge Impact; Better Legislation Can Help
Planned obsolescence — the design choice by manufacturers for devices to only be used for a couple of years — combined with a culture of always getting the newest, shiniest devices, means that e-waste quantities are increasing at a faster and faster rate.
To mitigate the problem, educating people on the impact of their device use would be a good start: a study by the University of California, Irvine, found that by increasing device life cycles by 50 to 100 percent through reducing, reusing, and recycling, annual emissions resulting from e-waste can be cut by up to 28 million metric tons annually.
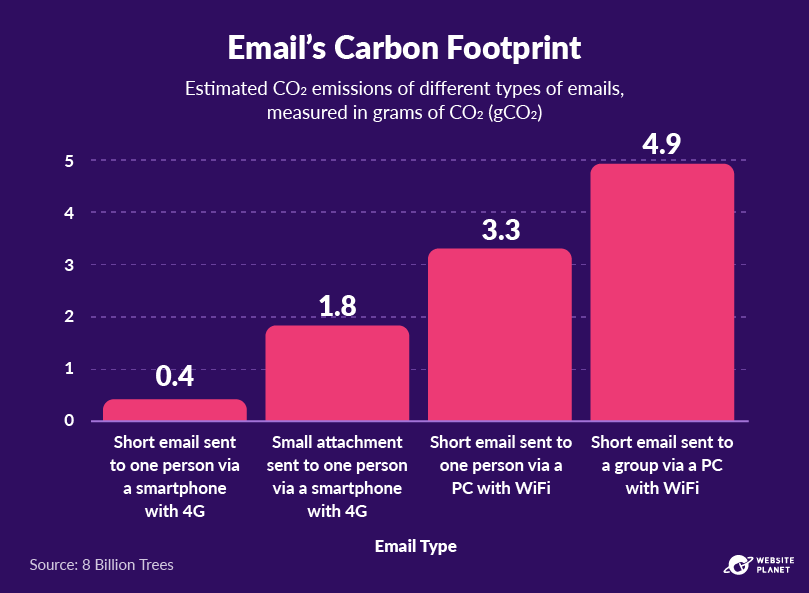
#23: Everyday Emails Have a Cost, Too
Sending an email requires energy. Energy is needed to power the devices you send it to and from. Plus, energy is needed to run the network and data centers that help store, transfer, process, and analyze each message.
Certain factors may affect an email’s energy consumption and therefore emissions. Emails that contain attachments require more storage and take longer to process. Emails with multiple recipients are transferred, stored, and read more than once. Meanwhile, PCs use more energy than smartphones, hence why an email sent from one generates more emissions.
Consumer Media
Consumer media, such as social media platforms, have become an inextricable part of everyday life across the globe. In this section, we’ll explore the carbon footprints of popular consumer media.
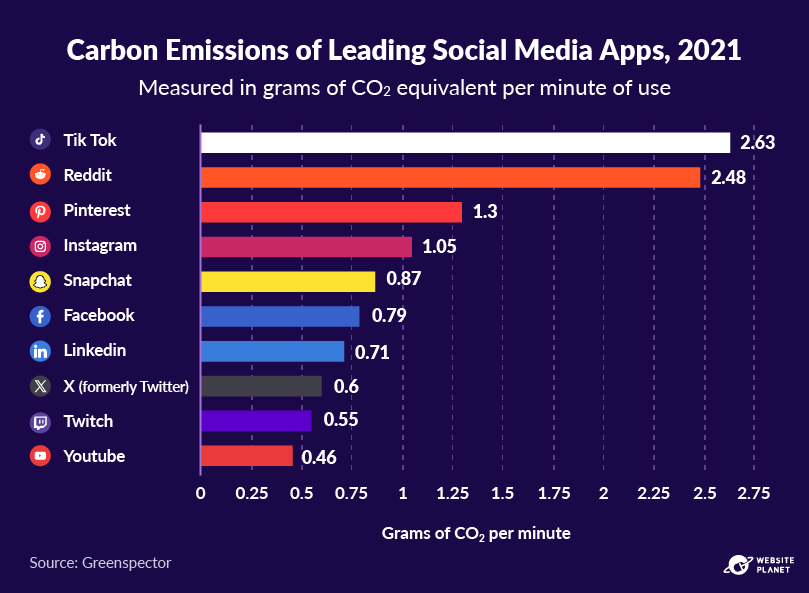
#24: TikTok’s Carbon Footprint Dwarfs Other Social Media Apps
Internet users today spend an average of 151 minutes on social media platforms each day. If one person spent all of these minutes scrolling on TikTok’s news feed, over an entire year, this would amount to 145 kg of CO2 emissions — the equivalent of driving a gasoline-powered car for over 370 miles.
Interestingly, despite also being video platforms, the news feeds of YouTube, Facebook, and Twitch all have significantly lower emissions per minute than TikTok, at over 70% less. However, since these platforms typically involve longer videos, they’re likely to have higher total cumulative emissions.
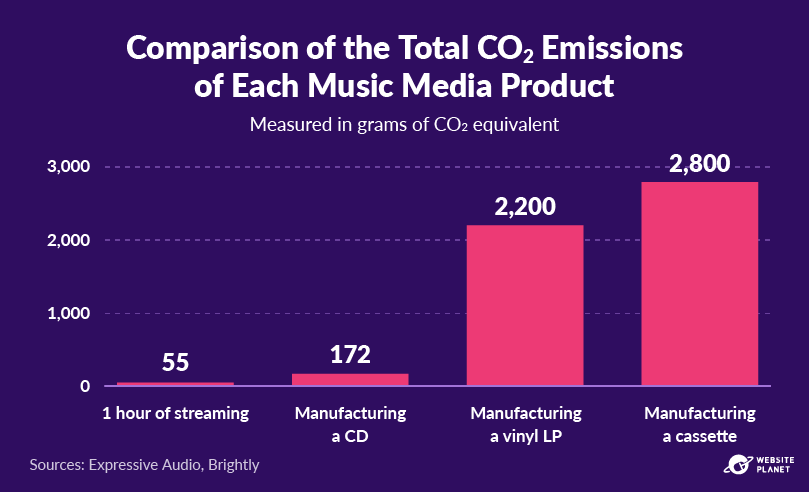
#25: Streaming Music Can Be More Energy Efficient than Traditional Media
Most social media platforms encourage carbon-intensive activities such as watching videos or chatting in real-time. Music streaming services like Spotify and Apple Music, however, often have a smaller carbon footprint compared to traditional listening means such as CDs or vinyl.
Without accounting for the device used to play the CD/vinyl/cassette, streaming 3 hours of music has around the same footprint as the manufacture of a single CD, 40 hours to match the footprint of manufacturing a vinyl record, and 50 to match that of a cassette.
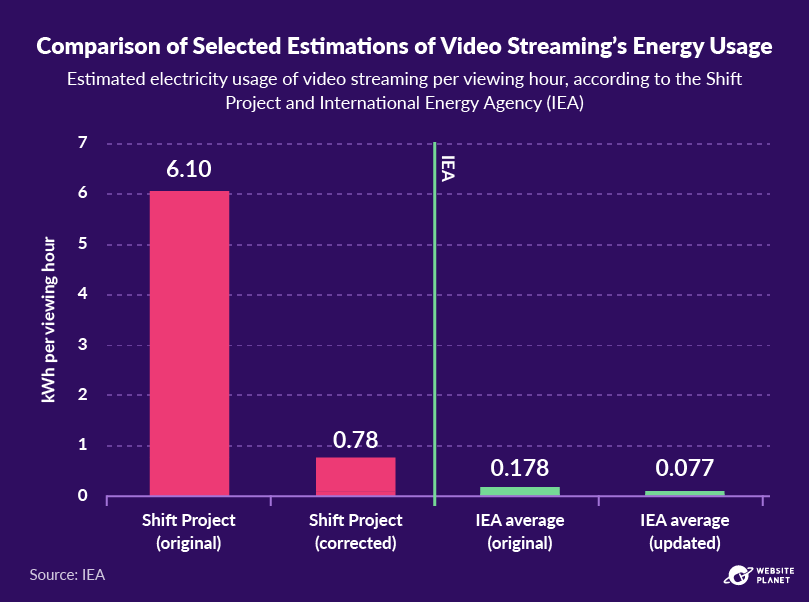
#26: The Impact of Streaming Video Has Often Been Overstated
A report from the International Energy Agency (IEA) found that contrary to various mainstream media coverage, the climate impacts of video streaming services were relatively modest when compared with other activities.
It cited a 2019 report by the Shift Project, a French think tank, as a particularly misleading report. Shift Project’s report stated that streaming was responsible for more than 300 million metric tons of CO2 in 2018, equivalent to all of France’s emissions. The think tank revised its figures down the following year, acknowledging its original numbers were off by a whopping 8-fold.
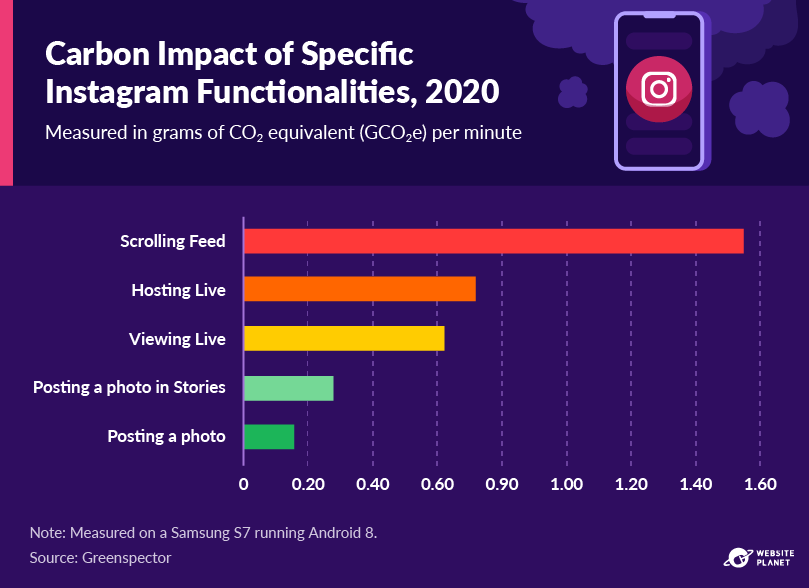
#27: Scrolling through Instagram Timelines Comes at a Hefty Environmental Cost
With Instagram’s popularity as a leading social media platform — not just for individuals but also for businesses — its carbon impact should be considered.
Scrolling through Instagram timelines is the most energy-intensive feature of Instagram, causing more than twice the carbon impact of the next most intensive feature, live hosting.
Going forward, the best ways to address this problem may include Meta moving Instagram to server farms that are powered by greener energy, and user devices moving toward being more energy and data efficient.
Search Engines and Artificial Intelligence
With more and more search engines adopting technologies such as artificial intelligence and privacy features into their infrastructure, the emission cost is significant. Let’s look at some facts and figures surrounding these platforms.
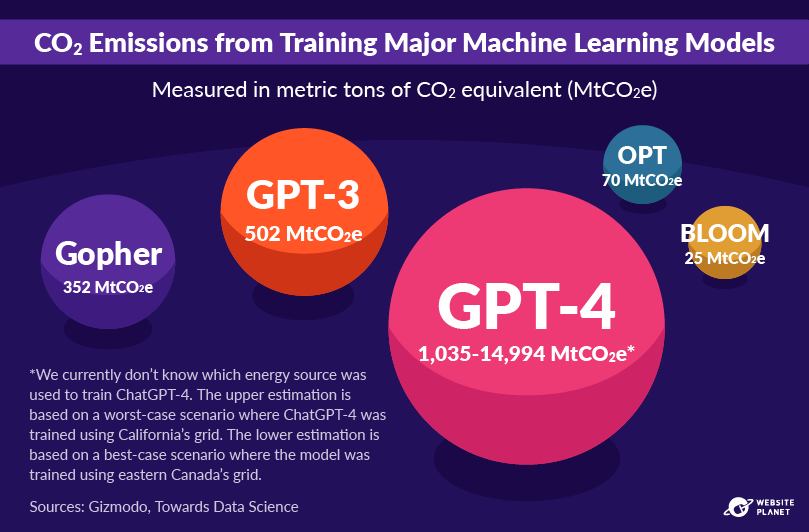
#28: The Rising Carbon Footprints of Popular Large Language Models
The artificial intelligence industry is currently experiencing an emergence of usefulness and popularity. This is particularly true of natural language processing (NLP) models which use deep learning to approximate human speech.
To continue developing these models, the sizes of the data sets used to train them are growing rapidly — and their energy consumption and emissions figures are growing exponentially as a result. For instance, depending on the mixture of renewable and non-renewable electricity, GPT-4’s training could have resulted in carbon emissions ranging from 1,035 to 14,994 MtCO2e, which reflects a potential increase of up to 30 times that of its predecessor.
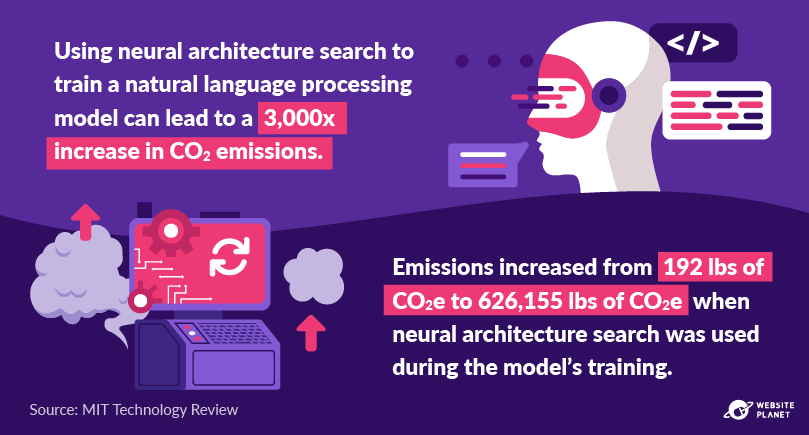
#29: The Last Steps of Tuning an AI Model Are the Most Carbon Intensive
Neural architecture search employs an exhaustive approach to optimizing natural language processing (NLP) models. This process demands massive amounts of computing power — so large, in fact, that the emissions created from using neural architecture search are far higher than the yearly emissions of the average human.
Despite this heavy demand on computing power, neural architecture search only offers marginal increases in search accuracy. However, this may well improve over time, with improvements being made in both algorithms and hardware.
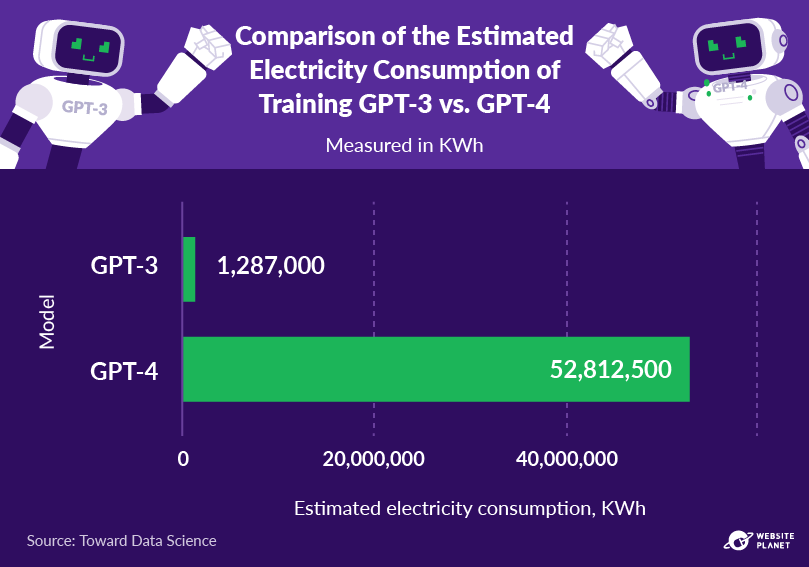
#30: ChatGPT’s Popularity Is Causing Its Impact to Skyrocket
ChatGPT’s emergence from relative obscurity in late 2022 has led to a substantial uptick in usage and potentially significant environmental costs. The popularity of the platform may carry with it a steep increase in emissions due to the heightened demand and consequent energy use.
Daily usage is one of the key drivers of ChatGPT’s emissions, but it isn’t the only one. Training these models is one of the most substantial costs. For instance, GPT-3’s training is estimated to have consumed 1,287,000 kWh. Meanwhile, GPT-4 is estimated to have required a staggering 52,812,500 kWh. The increase shows how emissions are scaling as AI technology advances.
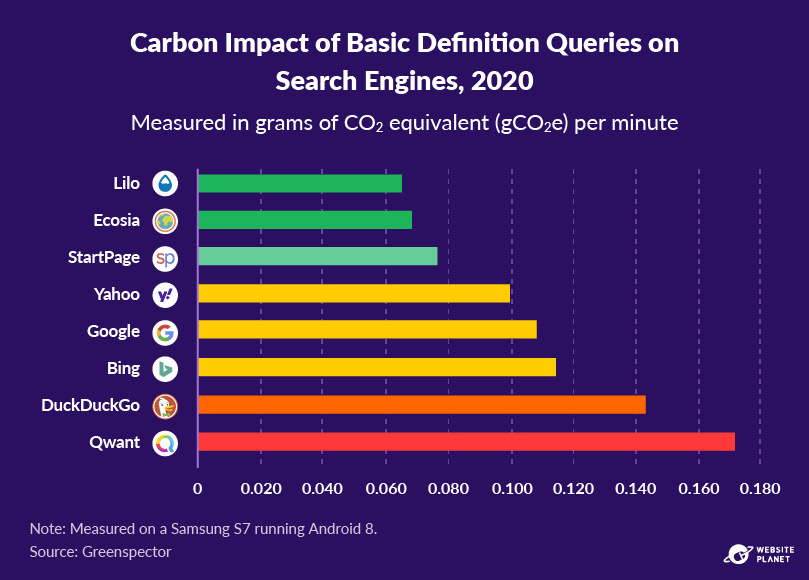
#31: Not All Search Engines Are Created Equal
Every search engine is powered by different infrastructure, and this means their emissions vary significantly. On average, an online search has a carbon impact of 0.106 CO2e, roughly equivalent to driving 1 meter in a car.
When you consider that Google alone gets around 99,000 search requests every second, or over 8.5 billion requests per day, this figure adds up to an incomprehensibly large number.
DuckDuckGo and Qwant have the highest carbon impacts per search. These two engines prioritize user privacy and demand more memory and resources per search than some of their competitors.
On the other hand, Lilo, Ecosia, and StartPage all have very low memory and resource demands to perform a search, giving them a net-low carbon footprint per search.
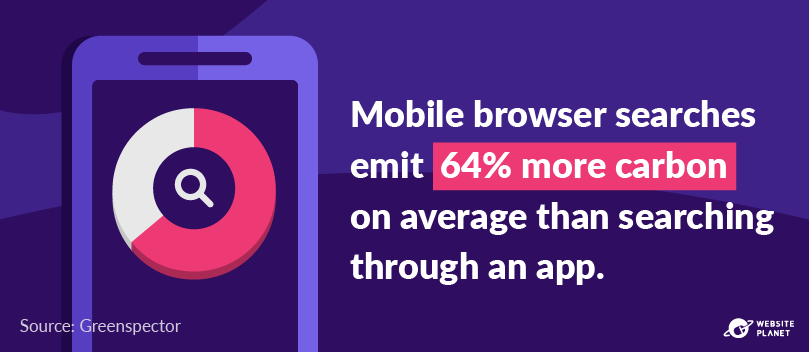
#32: Using a Mobile App Search Can Lower Your Carbon Footprint
In a study, Greenspector found that most search engines are far more energy efficient via their mobile applications, rather than on their browser-based counterparts. This is likely due to the nature of mobile applications, where they’re designed for one specific operating system rather than as a one-size-fits-all variant.
The study also found that some ways users can further reduce their carbon footprints for mobile searches include using autocomplete (for a 14% drop in carbon emissions), using a dark theme (for a 3% reduction), and deactivating news feeds.
Emissions in FinTech and E-commerce
Fintech and e-commerce are booming sectors, and both have a substantial environmental impact. In this section, we break down the quantity and source of these emissions, and how some of the industry’s players are taking the initiative to curtail them.
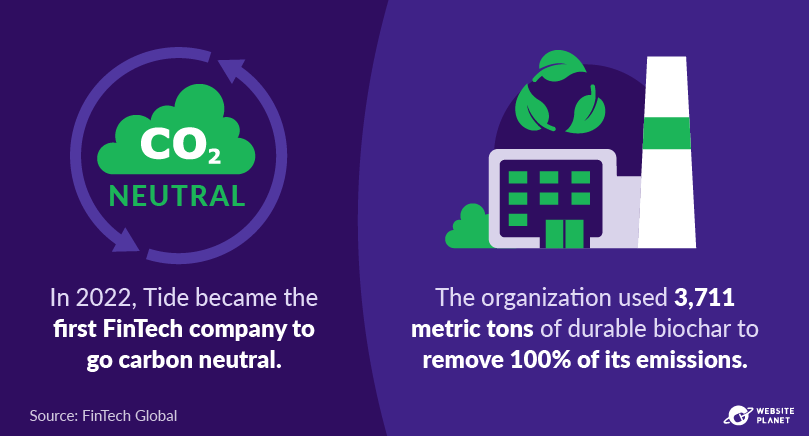
#33: FinTech Company Tide Becomes First to Remove 100% of Its Carbon Emissions
As an industry, fintech doesn’t have the same heavy physical infrastructure burden as other industries — however, there are still significant carbon footprints associated with the delivery of financial services. The main source of these emissions is the energy required to operate data centers, servers, and physical offices.
By pledging to be fully net-zero emissions by 2030, and having already offset 100% of its emissions, UK-based fintech company Tide has set a high bar for other fintech businesses to meet. It did this primarily through an ongoing investment in decarbonization and durable carbon removal — a market that’s still nascent, but seeing increased investment across the industry.
Hopefully, this is just one example of a trend in the fintech space that will continue over the next few decades.
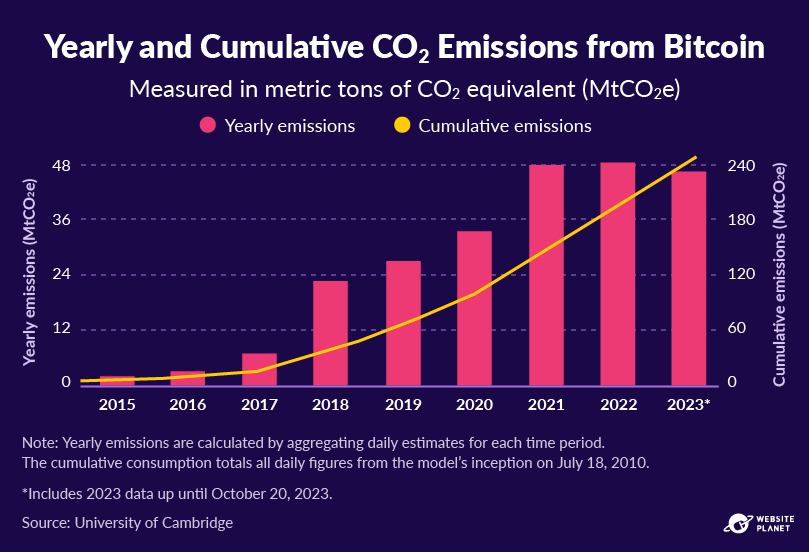
#34: Bitcoin Emissions Continue to Soar
The cryptocurrency industry, with Bitcoin at its helm, continues to be a major contributor to global greenhouse gas emissions. While Bitcoin emissions remained consistent in 2022, they’re estimated to reach an all-time high in 2023, having nearly matched 2022 emissions in just the first three quarters of the year.
Some jurisdictions are introducing mandates forcing Bitcoin mining farms to only operate in areas with access to renewable energy. If we see more of this in the coming years, Bitcoin’s environmental impact may be reduced.
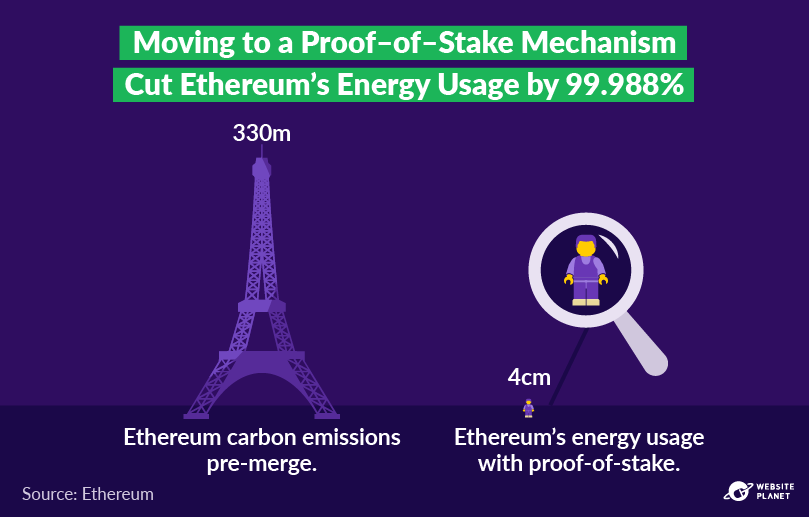
#35: Second Largest Cryptocurrency Slashes Virtually All Its Emissions
The second largest cryptocurrency, Ethereum, shifted away from its power- and emission-heavy proof-of-work consensus mechanism to a proof-of-stake mechanism in September 2022.
This change meant that it no longer required its miners to perform computationally intensive tasks, reducing the blockchain’s energy usage by 99.988%. In turn, this reduced Ethereum’s annual emissions from over 11 million metric tons of carbon dioxide — nearly a quarter of Bitcoin’s emissions — to around 870 tonnes of carbon dioxide annually; a 99.992% drop.
This was a huge milestone for the industry, and one that many newer cryptocurrencies have taken note of. Several cryptocurrencies have launched with similar models, which don’t require power-intensive mining operations in the way that Bitcoin and other proof-of-work models do.
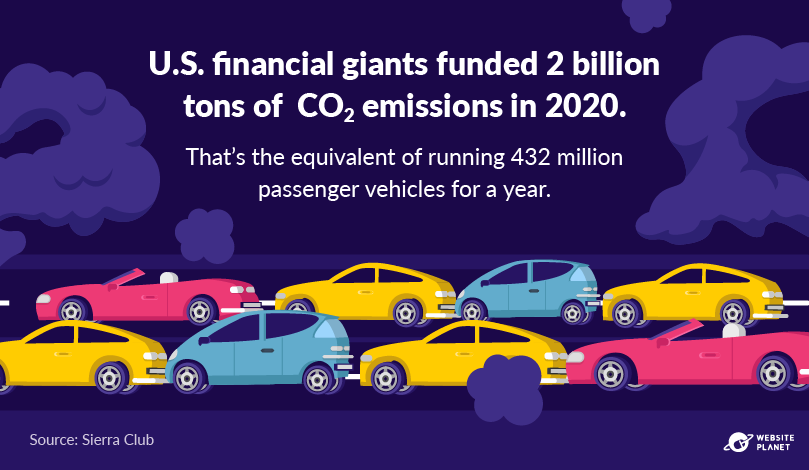
#36: Large Financial Players Continue to Fund Massive CO2 Emissions
For nations to meet their climate goals, legislation for large banks to disclose their emissions needs to improve. Despite not including Scope 3 emissions, the largest banks and the assets they fund create enormous amounts of emissions.
The major US banks and asset managers have announced exclusion policies for future investments, lending, and equity underwriting in industries that produce or use fossil fuel energies such as Arctic drilling, coal mining, and coal-fired electricity. However, their commitments fall short of their international counterparts and often only apply to project finance — meaning they will continue to finance billions of dollars to companies expanding production.
To meet their net-zero goals by 2050, these banks and asset managers will need to commit to gradually phasing out corporate-level finance for companies expanding fossil fuels as well.
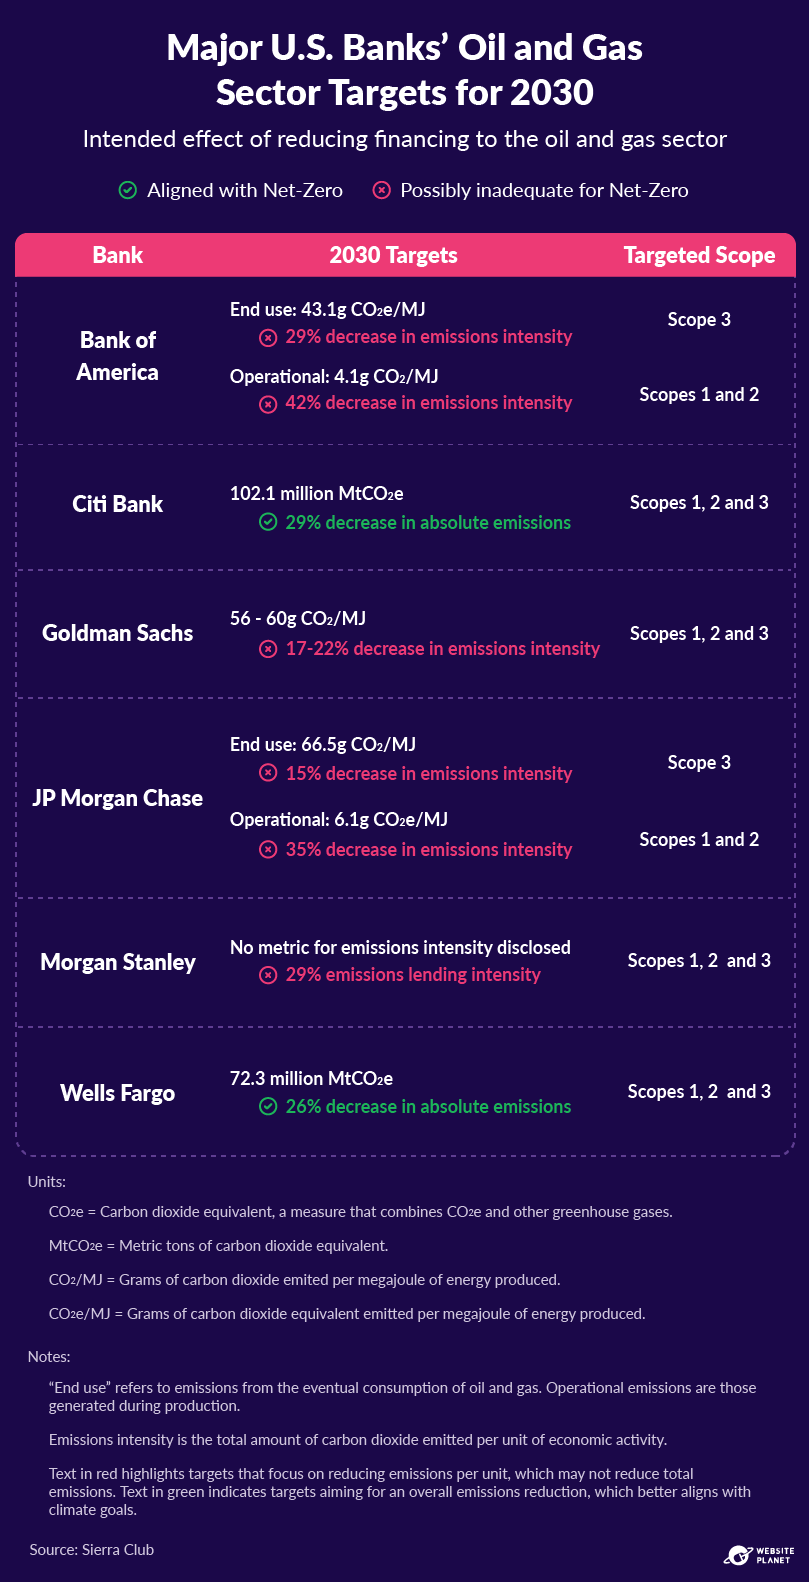
#37: Major US Bank Emission Targets Aren’t Where They Need to Be
Of the six major US banks shown in the infographic, only Wells Fargo and Citigroup have made clear oil and gas sector targets that adequately align with the Paris Agreement’s mission to achieve net-zero emissions by 2050.
The other four banks announced targets that focused on reducing oil and gas emission intensity rather than targets relating to absolute emissions. Emission intensity targets still allow for increasing investment into oil and gas, which diminishes the impact of these targets and makes it unclear whether or not this will suffice to achieve net-zero by 2050.
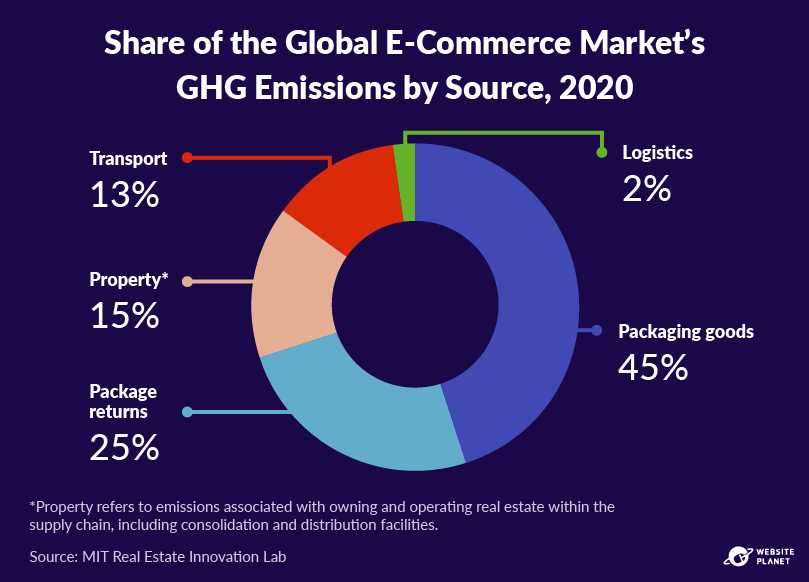
#38: Packaging Is Responsible for a Surprisingly High Share of Ecommerce Emissions
On the face of it, transport and logistics would seem to be the most likely cause for the majority of e-commerce emissions. However, this is far from the case, with packaging-level emissions accounting for nearly half of all emissions in the industry.
One key driver of these packaging-level emissions is the production of plastic film packaging. According to analyst estimates, as much as 90% of these plastics are made from fossil fuels. And with online shopping becoming increasingly common each year, this trend isn’t likely to slow down — unless, of course, governments mandate greener packaging.
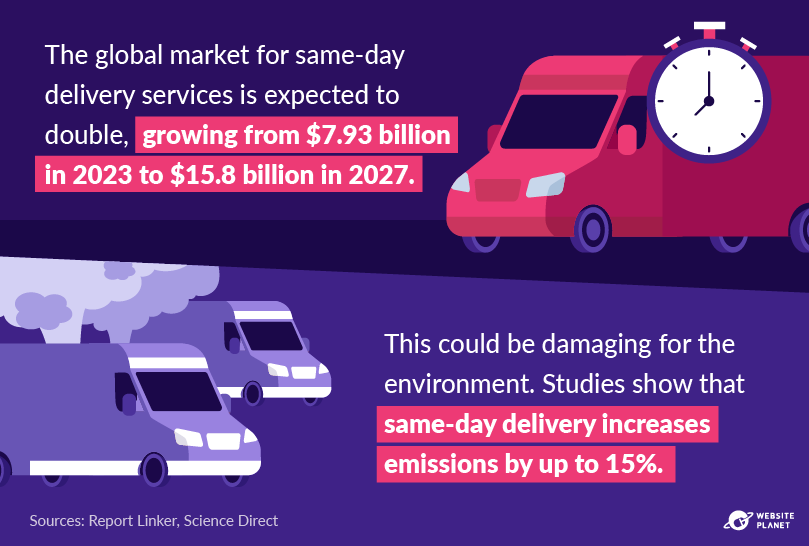
#39: Same-Day Delivery Is Becoming the New Norm
Over the last decade, and particularly since the COVID-19 pandemic, cultural expectations have shifted further toward the convenience of faster delivery times, including same-day delivery.
Same-day shipping has a huge impact on emissions, as it forces delivery drivers to follow less efficient routes, opting instead for faster, poorly optimized routes. In addition, this cultural shift also increases the frequency of misdeliveries and returned items, causing more wasted journeys, and as a result, more emissions on their re-deliveries.
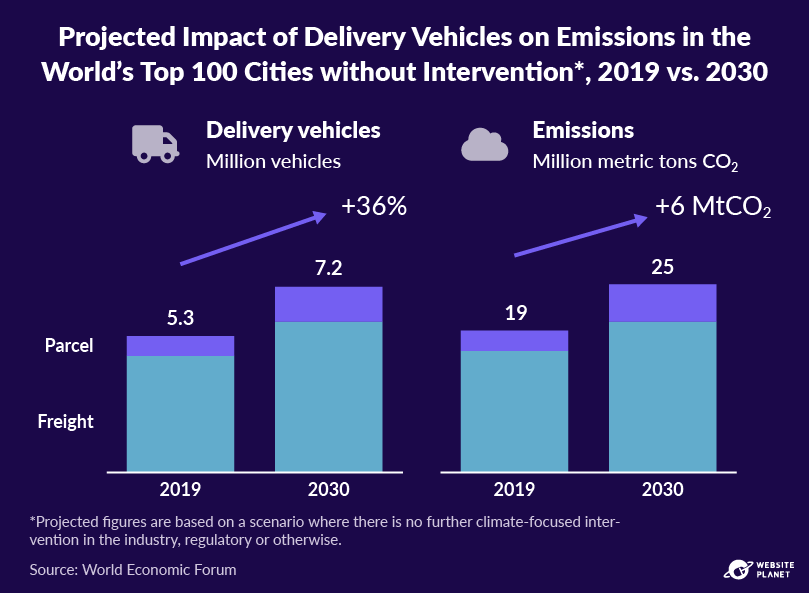
#40: More Delivery Vehicles Will Increase Traffic Congestion
As a result of increased reliance by consumers on online shopping and fast turnaround, the number of delivery vehicles on the road is expected to continue to increase to meet demands.
In addition to leading to a significant increase in carbon emissions, this is likely to lead to increased traffic, increasing the commute times of people living in these cities by up to 21%, as estimated by the World Economic Forum. Many of these delivery vans operate in congested inner city areas — and as a result, each time they pull over to make a delivery, they likely cause further congestion.
The Road to Lower Emissions
Having examined several current and past facts and figures about the tech industry and its emissions, in this section, we turn our attention forward. Let’s take a look at the outlook for the century ahead, and what needs to happen for global climate goals to be achieved.
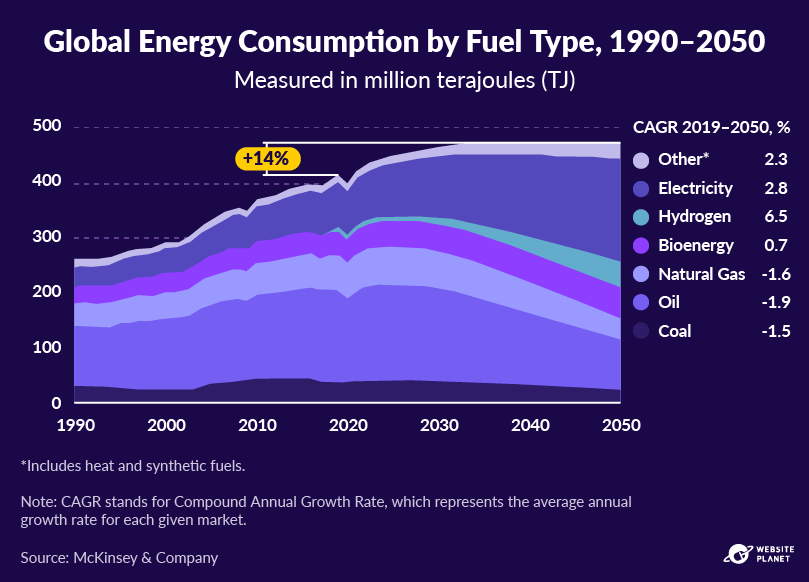
#41: Global Fossil Fuel Consumption Is Likely to Go Up before It Comes Down
A 2022 study by McKinsey forecasts that before fossil fuel — oil, coal, and natural gas — consumption starts to decrease and be replaced over time with renewable energy sources, their consumption is actually likely to go up over the next few years, with a peak in the mid-2020s.
McKinsey also predicted that thanks to technology that enables more efficient use of electricity, by 2050 energy consumption is only going to be 14% higher than in 2019. This is certainly a positive forecast, but it requires that over the next decade, infrastructure for more renewable energy be put in place.
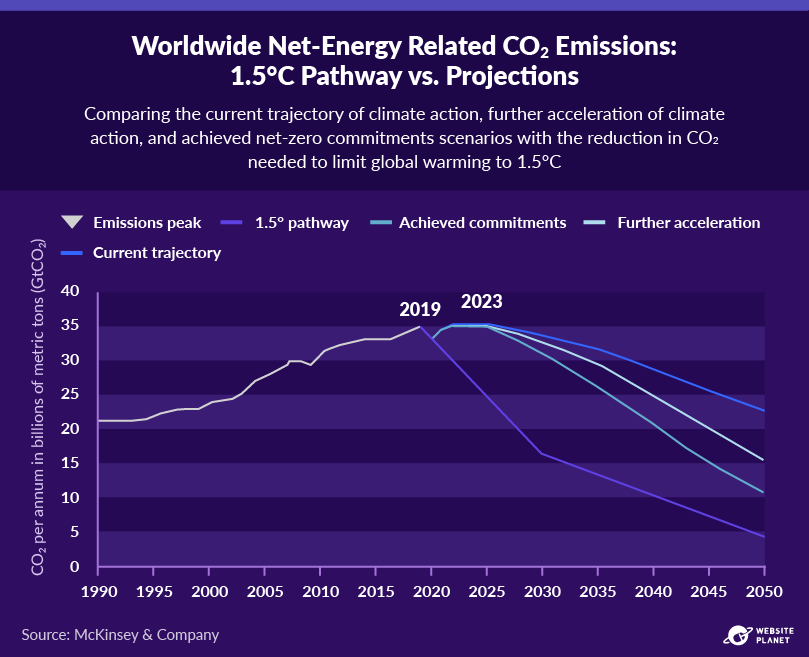
#42: The Paris Agreement Goals Are Still out of Reach
In the Paris Agreement, member nations pledged to limit the global rise in temperature to a 1.5C increase from pre-industrial averages.
Currently, the average atmospheric increase is 1.2C over pre-industrial norms. The current emissions trajectory isn’t anywhere near where it needs to be to achieve climate goals, as per McKinsey’s forecast. Based on the world’s current path, the global mean temperature is most likely to increase by 1.7 – 2.4C by 2100, with a less likely scenario where temperatures increase even more.
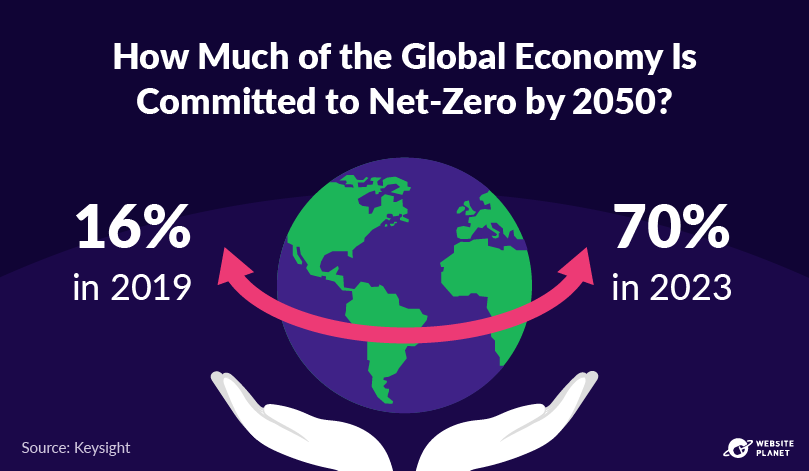
#43: Net-Zero Pledges Have Quadrupled since 2019
Pledges to reduce emissions and eventually transition to net-zero are crucial steps in achieving climate goals. As more companies do, pressure is put on those that haven’t to follow suit. Emissions may go up before they go down, but on the whole, industries are making strides in the right direction.
As we venture further into the mid- and late-2020s, emission figures are likely to continue to look alarming. However, as long as mandates and infrastructure for a greener world are put in place, we may well be able to limit global warming to the 1.5C goal.
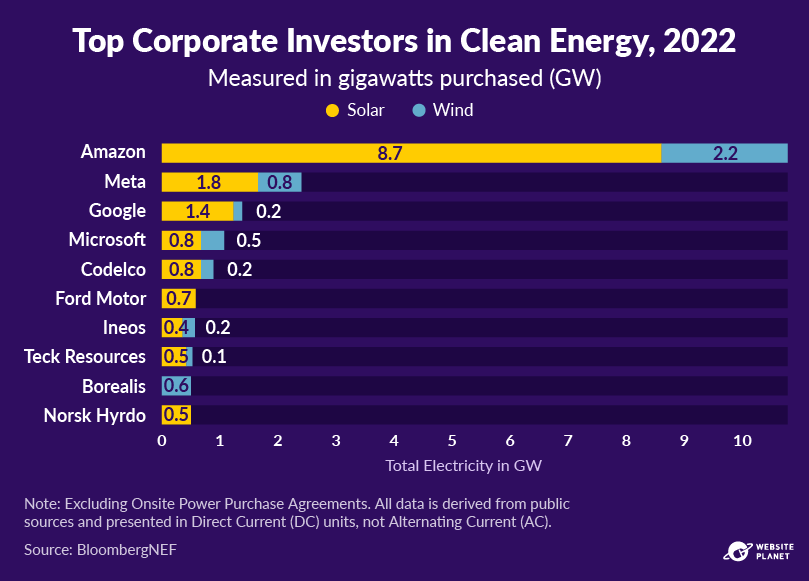
#44: Big Tech Companies Lead the Charge in Clean Energy Purchases in 2022
The amount of clean energy purchased every year is trending up, and rising exponentially.
Over half the clean energy deals made in 2022 were signed by Big Tech giants Amazon, Meta, Google, and Microsoft. This is a significant step forward, as it signals their intention to clean up their emissions in the years to come, and strive to be net-zero by 2050 as per the Paris Agreement.
However, some of these companies still use dirty energy due to their office locations and their regional energy availability. To tackle this, over the coming years, they’ll need to relocate away from such regions to move entirely to greener energy.
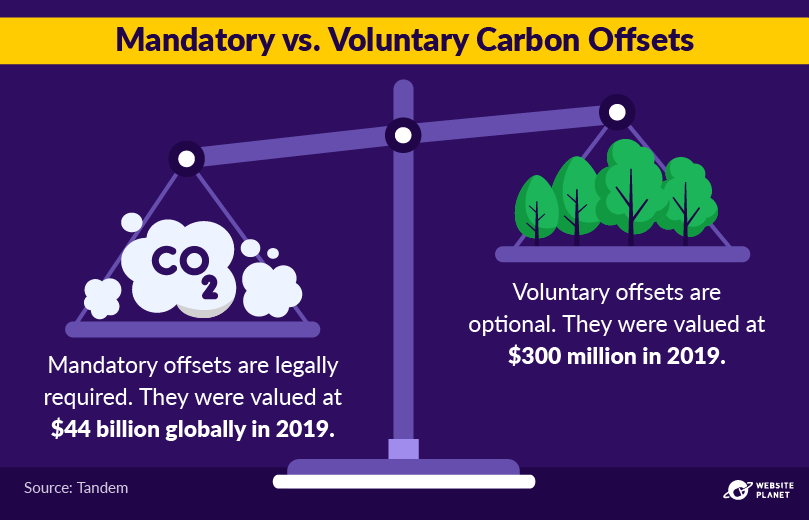
#45: Mandatory Carbon Offsets Need to Be Higher
Voluntary offsets are purchased at a much lower rate than mandatory offsets. This indicates that individuals and corporations tend to do what’s required of them from a legal point of view, but don’t go the extra mile of their own accord — suggesting that mandating more offsets is the best way to bolster the offset market.
Carbon offsets tend to elicit mixed opinions, however — activists often disagree with the notion that environmentally damaging companies can be given an option to simply “throw money at the problem” and absolve themselves of any responsibility.
It is undeniable that ideally, companies should buy offsets while also proactively mitigating their emissions. However, regardless of this, the offsets do help toward reducing carbon dioxide in the atmosphere.
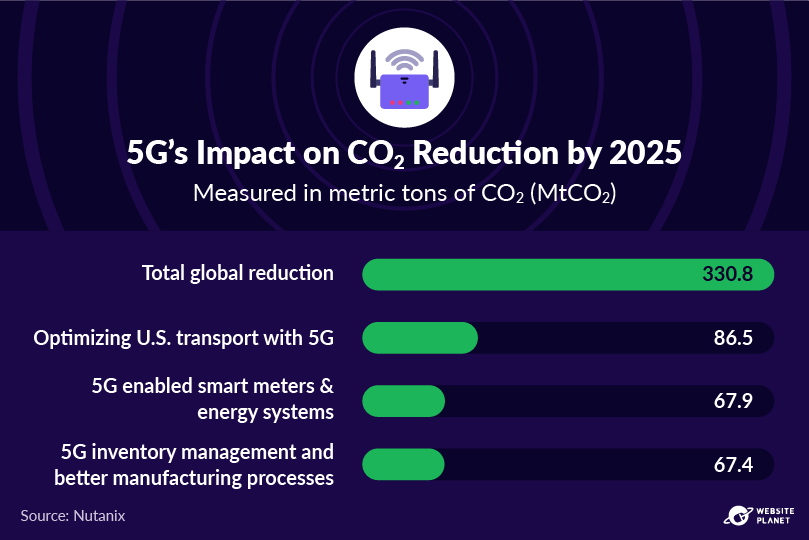
#46: 5G Could Help Slash CO2 Emissions
A report from Accenture found that 5G technology could be applicable in use cases far beyond consumer mobile networks, and can conceivably be used to optimize systems and networks.
It suggests that using innovations like smart cities, optimized buildings, streamlined transport networks, and more efficient inventory stocks and manufacturing, all enabled by 5G technology, could reduce carbon dioxide emissions each year.
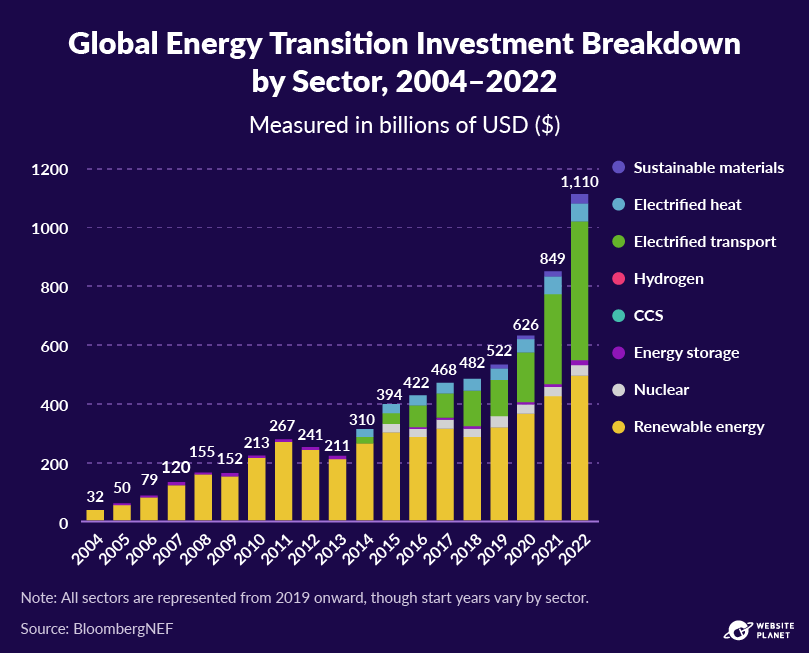
#47: The Decarbonization Industry Is Growing Rapidly
We’re starting to see massive — and growing — investments in technologies that enable large-scale shifts away from high-emission energy sources such as fossil fuels like coal and gas.
Companies producing tech to remove or reduce carbon emissions are expected to reach a combined market value of $1.4 trillion by 2027, according to market research by Pitchbook, growing an expected 8.8% per year for the next four years.
The green industry refers to companies focusing on decarbonizing the industrial production of chemicals and raw materials, producing renewable energy, recycling, and decarbonizing the atmosphere.
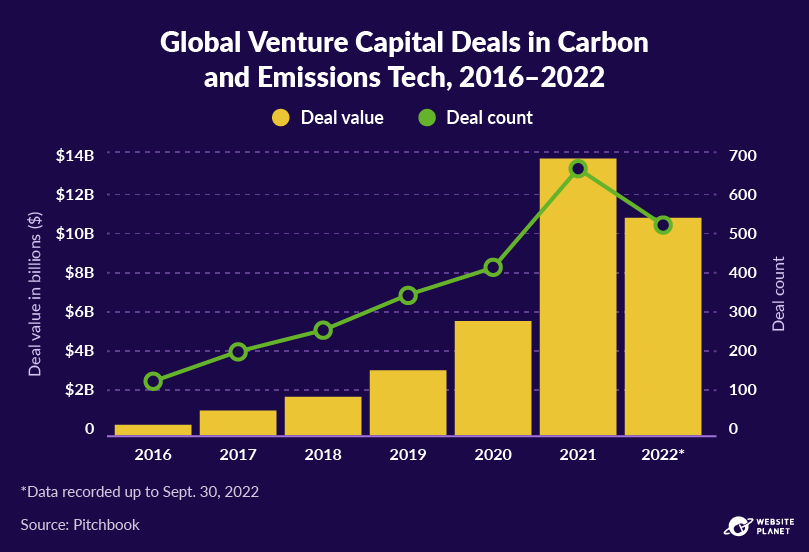
#48: Investors Back Clean Energy Tech amid Shaky Economy
In 2022, the carbon and emissions tech sector, which encompasses startups developing technologies for carbon capture, storage, and emissions reduction, saw continued interest from investors.
Venture capital funding amounted to $10.7 billion across 517 deals throughout the first three-quarters of the year, placing the industry on a path to equal 2021’s figures.
Among other programs, the Biden administration’s Inflation Reduction Act from 2022 is thought to have influenced a significant portion of this heavy investment. The legislation committed around $370 billion toward climate change, including subsidies for tech companies furthering that cause.
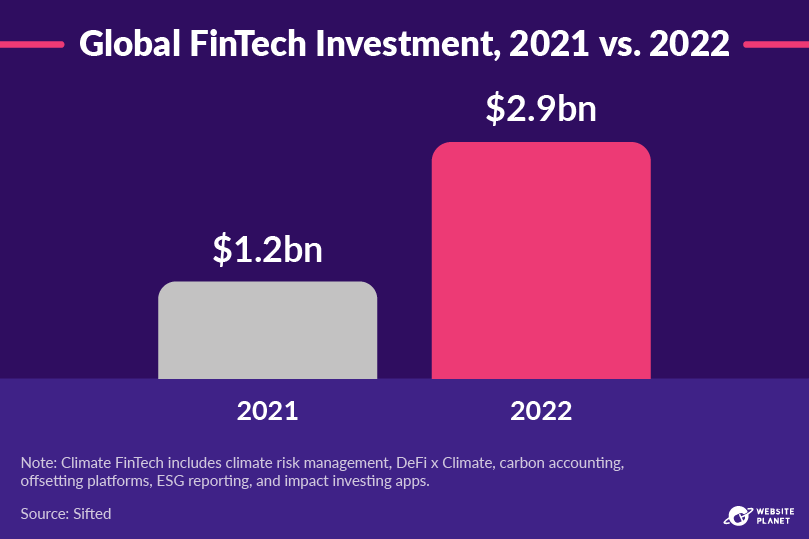
#49: Climate Fintech Could Help Raise the Bar Industry-Wide
Climate fintech is an emerging niche within fintech, focusing on developing software and models that help companies achieve environmental goals. These include tracking their carbon emissions more accurately; providing climate risk management analytics; carbon offsetting; Environmental, Social, and Governance (ESG) reporting; impact investing (investing aimed at beneficial effects); and climate crypto (the use of crypto-technologies to drive action on climate change).
Carbon accounting (the measurement of how much greenhouse gas an organization emits) is the category within climate fintech that attracts the lion’s share of investments in the space, taking nearly a third of all investment across climate fintech in the first half of 2022.
Looking Ahead
In terms of emissions, the last few decades have been a decidedly mixed bag — in the latter half of the 20th century, for the most part, both the tech industries and their emissions grew at a breakneck pace, with few companies showing much regard for keeping them under control.However, in the last two decades in particular, increasingly many tech companies are showing great progress in curtailing their emissions — and more generally, signaling their intent to play their part in getting us on track to achieve the goals set out by the Paris Agreement.
Content attribution: Website Planet is the sole owner of the visual and written content on this website. You are free to share our content and visuals on your site, but we ask that you provide a link back to the resource if you do, enabling us to continue providing authoritative reviews and guides to help individuals and businesses thrive online.